Image:Petrol use urban density.JPG
From Wikipedia, the free encyclopedia
No higher resolution available.
Petrol_use_urban_density.JPG (560 × 468 pixels, file size: 60 KB, MIME type: image/jpeg)
Summary
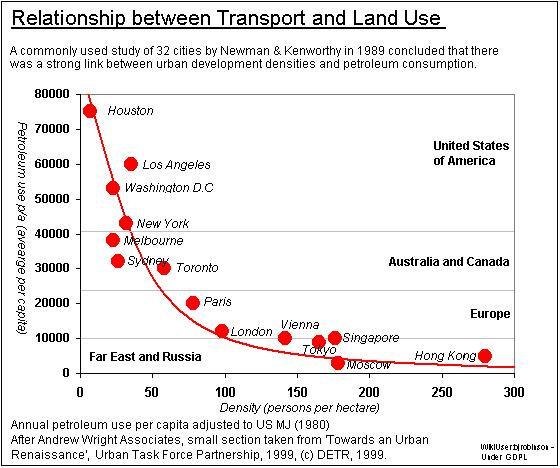
A graph showing the relationship between urban density and petrol use
Newman and Kenworthy’s 1989 study is often referred to in demonstrating a relationship between overall urban density and transport energy use. Newman and Kenworthy’s statistical methods have been criticised by a number of authors. The essential problem is examining the relationship between ‘motor spirit use per person’ and ‘persons per hectare’. Because population is in the denominator in one term and the numerator in the other, a spurious correlation emerges. Reanalysis of the primary data comparing gasoline use per person to area per person shows a more complex relationship. The revised graph shows this.
Licensing
| |
I, the creator of this work, hereby grant the permission to copy, distribute and/or modify this document under the terms of the GNU Free Documentation License, Version 1.2 or any later version published by the Free Software Foundation; with no Invariant Sections, no Front-Cover Texts, and no Back-Cover Texts. Subject to disclaimers. |
File history
Click on a date/time to view the file as it appeared at that time.
| Date/Time | Dimensions | User | Comment | |
|---|---|---|---|---|
| current | 12:28, 20 February 2006 | 560×468 (60 KB) | Bjrobinson ( Talk | contribs) | (A graph showing the relationship between urban density and petrol use) |
See the setup instructions for more information.