Image:Internet-explorer-usage-data.svg
From Wikipedia, the free encyclopedia
Internet-explorer-usage-data.svg (SVG file, nominally 570 × 290 pixels, file size: 5 KB)
| |
This is a file from the Wikimedia Commons. The description on its description page there is shown below. |
Summary
License information
 |
This image has been (or is hereby) released into the public domain by its author, El T at the wikipedia project. This applies worldwide. In case this is not legally possible: |
Original upload log
(All user names refer to en.wikipedia)
- 2007-02-02 14:08 Schapel 570×290×0 (4065 bytes) New graph created from data in the [[usage share]] article
- 2006-08-17 14:58 Henrikb4 566×290×0 (3084 bytes)
- 2006-06-25 13:11 El T 566×290×0 (3108 bytes) An SVG version of the graph. The easiest way to update the graph is to use a TEXT editor, NOT a graphics one. Just find the list of numbers and add in the statistic you want to use. Just make sure you put them in order. If you are adding data for before
File history
Click on a date/time to view the file as it appeared at that time.
| Date/Time | Dimensions | User | Comment | |
|---|---|---|---|---|
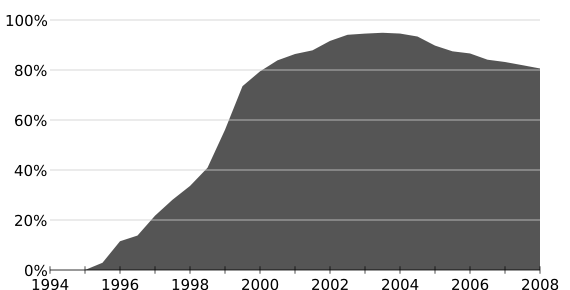
| current | 22:27, 10 February 2008 | 570×290 (5 KB) | Schapel | ({{Information |Description=Usage share of Internet Explorer |Source=self-made |Date=2008-02-10 |Author= Schapel |Permission= |other_versions= }} ) |
| 22:08, 10 February 2008 | 570×290 (5 KB) | Schapel | ({{Information |Description=Usage share of Internet Explorer |Source=self-made |Date=2008-02-10 |Author= Schapel |Permission= |other_versions= }} ) | |
| 21:02, 7 July 2007 | 600×290 (4 KB) | SteveSims | (Midway through 2007 data added. Remember to delete the 2007.5 tick when the end of 2007/beginning of 2008 data is added.) | |
| 15:08, 2 April 2007 | 570×290 (4 KB) | Liftarn | ({{Information |Description=This file is in SVG format. That means you can edit it with a text editor or an SVG-compatible graphics editor. ''However,'' you will find it better to use a text editor because otherwise your edits will be too imprecise. === A) |
File links
The following pages on Schools Wikipedia link to this image (list may be incomplete):