Image:2004chicken.PNG
From Wikipedia, the free encyclopedia
Size of this preview: 640 × 281 pixels
Full resolution (1,425 × 625 pixels, file size: 61 KB, MIME type: image/png)
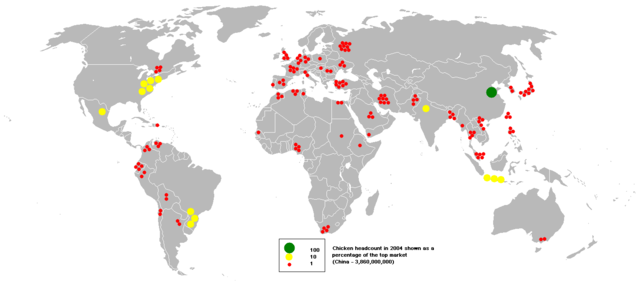
This bubble map shows the global distribution of chickens in 2004 as a percentage of the top market (China - 3,860,000,000).
This map is consistent with incomplete set of data too as long as the top market is known. It resolves the accessibility issues faced by colour-coded maps that may not be properly rendered in old computer screens.
Data was extracted on 11th June 2007 from http://www.fao.org/ag/aga/glipha/index.jsp
Based on Image:BlankMap-World.png
Licensing
 |
I, the copyright holder of this work, hereby release it into the public domain. This applies worldwide. In case this is not legally possible, |
File history
Click on a date/time to view the file as it appeared at that time.
| Date/Time | Dimensions | User | Comment | |
|---|---|---|---|---|
| current | 16:26, 11 June 2007 | 1,425×625 (61 KB) | Anwar saadat ( Talk | contribs) |
See the setup instructions for more information.