Image:MPanesarBowling.png
From Wikipedia, the free encyclopedia
Size of this preview: 640 × 330 pixels
Full resolution (1,175 × 606 pixels, file size: 15 KB, MIME type: image/png)
Summary
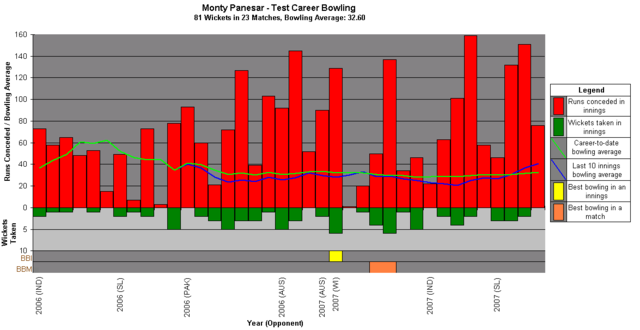
A graph that shows Monty Panesar's test career bowling statistics and how they have varied over time. It was created by Masai 162. This image was created using Microsoft Excel and MS Paint. Source Data obtained from www.howstat.com.au
This graph is up to date as of 23rd December 2007.
Licensing
 |
I, the copyright holder of this work, hereby release it into the public domain. This applies worldwide. In case this is not legally possible, |
File history
Click on a date/time to view the file as it appeared at that time.
| Date/Time | Dimensions | User | Comment | |
|---|---|---|---|---|
| current | 17:50, 23 December 2007 | 1,175×606 (15 KB) | Masai 162 ( Talk | contribs) | |
| revert | 21:07, 28 August 2007 | 1,187×593 (15 KB) | Masai 162 ( Talk | contribs) | (Changed the format of the graph (now uses bars to show number of wickets taken).) |
| revert | 20:38, 23 August 2007 | 1,050×593 (17 KB) | Masai 162 ( Talk | contribs) | (Changed the colour scheme to something better.) |
| revert | 18:25, 12 August 2007 | 1,050×593 (17 KB) | Masai 162 ( Talk | contribs) | (Reverted to earlier revision) |
| revert | 18:25, 12 August 2007 | 1,050×593 (17 KB) | Masai 162 ( Talk | contribs) | |
| revert | 18:19, 12 August 2007 | 1,050×593 (17 KB) | Masai 162 ( Talk | contribs) | (Graph now up to date as of 12th August 2007.) |
| revert | 20:32, 6 August 2007 | 1,048×594 (16 KB) | Masai 162 ( Talk | contribs) | (A graph that shows Monty Panesar's test career bowling statistics and how they have varied over time.) |
See the setup instructions for more information.
File links
The following pages on Schools Wikipedia link to this image (list may be incomplete):
Categories: User-created public domain images