Image:US Historical Inflation Ancient.svg
From Wikipedia, the free encyclopedia
US_Historical_Inflation_Ancient.svg (SVG file, nominally 800 × 400 pixels, file size: 15 KB)
Summary

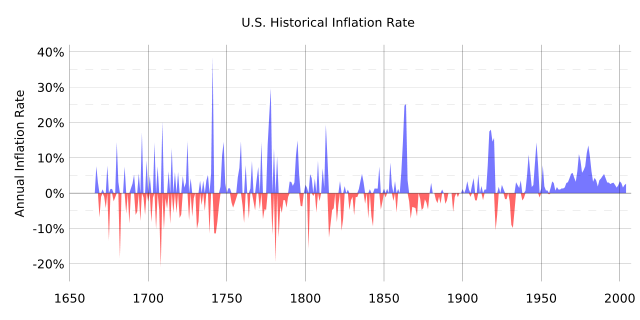
Historical inflation, using data from (pre-1913: McCusker study; post-1913: CPI)
1666 - 2004
Year-over-year change: (Thisyear-lastyear)/lastyear
Licensing
 |
I, the copyright holder of this work, hereby release it into the public domain. This applies worldwide. In case this is not legally possible, |
| |
This file is an exact duplicate of another file from the Wikimedia Commons. Unless it is currently protected from editing, this media file may qualify for speedy deletion if it satisfies these conditions. | |
File history
Click on a date/time to view the file as it appeared at that time.
| Date/Time | Dimensions | User | Comment | |
|---|---|---|---|---|
| current | 04:21, 29 August 2007 | 800×400 (15 KB) | Lalala666 ( Talk | contribs) | (Historical inflation, using data from [http://oregonstate.edu/Dept/pol_sci/fac/sahr/infcf16652005.pdf] (pre-1913: McCusker study; post-1913: CPI) 1666 - 2004 Year-over-year change: (Thisyear-lastyear)/lastyear) |
See the setup instructions for more information.
File links
The following file is a duplicate of this file:
The following pages on Schools Wikipedia link to this image (list may be incomplete):
Categories: User-created public domain images