Image:Luxembourg City climate.PNG
From Wikipedia, the free encyclopedia
Size of this preview: 640 × 393 pixels
Full resolution (977 × 600 pixels, file size: 5 KB, MIME type: image/png)
| |
This is a file from the Wikimedia Commons. The description on its description page there is shown below. |
Summary
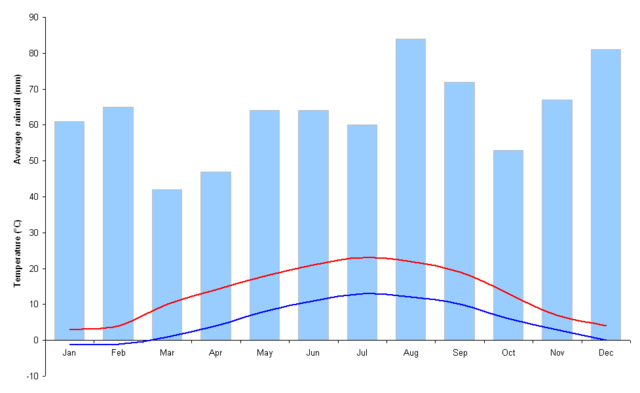
| Description |
Graph illustrating Luxembourg City's rainfall and maximum and minimum temperatures over the course of the year. Data from BBC Weather. |
||
|---|---|---|---|
| Source |
Own work. |
||
| Date |
19 July 2006 |
||
| Author |
User:Bastin8 |
||
| Permission ( Reusing this image) |
|

 |
This graph image should be recreated using vector graphics as an SVG file. This has several advantages; see Commons:Media for cleanup for more information. If an SVG form of this image is already available, please upload it. After uploading an SVG, replace this template with {{ vector version available|new image name.svg}}. |
|
العربية | Български | Català | Česky | Dansk | Deutsch | English | Esperanto | Español | Français | Galego | 한국어 | Italiano | Magyar | Lietuvių | Nederlands | 日本語 | Polski | Português | Română | Русский | Suomi | Svenska | Türkçe | Українська | 中文(繁體) | 中文(简体) | +/- |
|
File history
Click on a date/time to view the file as it appeared at that time.
| Date/Time | Dimensions | User | Comment | |
|---|---|---|---|---|
| current | 16:20, 4 May 2007 | 977×600 (5 KB) | Tene | (Optimised (5)) |
| 23:17, 19 July 2006 | 977×600 (26 KB) | Bastin8 | ({{Information |Description=Graph illustrating Luxembourg City's rainfall and maximum and minimum temperatures over the course of the year. Data from [http://www.bbc.co.uk/weather/world/city_guides/results.shtml?tt=TT004010 BBC Weather]. |Source=Own work.) |