Image:Instrumental Temperature Record.png
From Wikipedia, the free encyclopedia
Size of this preview: 640 × 474 pixels
Full resolution (800 × 593 pixels, file size: 41 KB, MIME type: image/png)
| |
This is a file from the Wikimedia Commons. The description on its description page there is shown below. |
 A vector version of this image (SVG) is available. For more information about vector graphics, read about Commons transition to SVG. Deutsch | English | Español | Français | Galego | עברית | Magyar | Italiano | 日本語 | 한국어 | Lietuvių | Polski | Português | Русский | Српски / Srpski | Українська | +/- |
 |
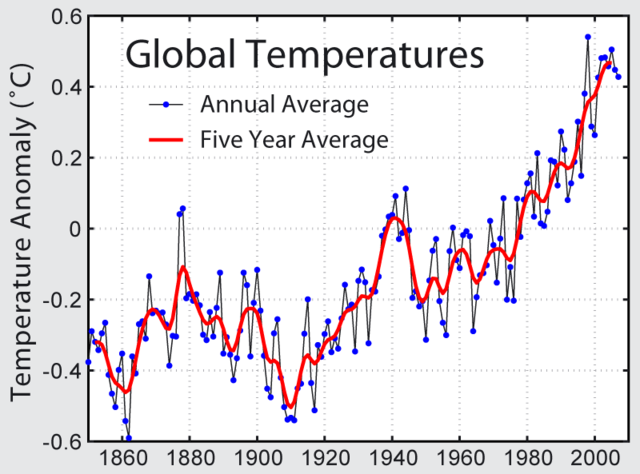
This image shows the instrumental record of global average temperatures as compiled by the Climatic Research Unit of the University of East Anglia and the Hadley Centre of the UK Meteorological Office. Data set TaveGL2v was used. The most recent documentation for this data set is Jones, P.D. and Moberg, A. (2003) "Hemispheric and large-scale surface air temperature variations: An extensive revision and an update to 2001". Journal of Climate, 16, 206-223.
This figure was originally prepared by Robert A. Rohde from publicly available data and is incoporated into the Global Warming Art project.
This image is an original work created for Global Warming Art.
Permission is granted to copy, distribute and/or modify this image under either:
- The GNU Free Documentation License Version 1.2; with no Invariant Sections, Front-Cover Texts, or Back-Cover Texts.
- The Creative Commons Attribution-NonCommercial-ShareAlike License Version 2.5
Please refer to the image description page on Global Warming Art for more information
 |
Permission is granted to copy, distribute and/or modify this document under the terms of the GNU Free Documentation License, Version 1.2 only as published by the Free Software Foundation; with no Invariant Sections, no Front-Cover Texts, and no Back-Cover Texts. A copy of the license is included in the section entitled " Text of the GNU Free Documentation License." Català | English | Español | Français | 日本語 | Polski | Português | Русский | Tiếng Việt | 中文(简体) | 中文(繁體) | +/- |
| Dragons flight's Temperature Record Series |
| This figure is part of series of plots created by Dragons flight to illustrate changes in Earth's temperature and climate across many different time scales. |
| Time Period: 25 yrs | 150 yrs | 1 kyr | 2 kyr | 12 kyr | 450 kyr | 5 Myr | 65 Myr | 500 Myr |
| For articles related to this topic see: Temperature record |
File history
Click on a date/time to view the file as it appeared at that time.
| Date/Time | Dimensions | User | Comment | |
|---|---|---|---|---|
| current | 07:48, 21 February 2008 | 800×593 (41 KB) | Dragons flight | (update to 2007) |
| 22:01, 2 September 2005 | 525×390 (42 KB) | Wisty | (Global warming picture from wikipedia) |