Image:Pie final.jpg
From Wikipedia, the free encyclopedia
Size of this preview: 635 × 480 pixels
Full resolution (1,824 × 1,378 pixels, file size: 406 KB, MIME type: image/jpeg)
| |
This graph image was uploaded in a raster image format such as PNG, GIF, or JPEG. However, it contains information that could be stored more efficiently and/or accurately in the SVG format, as a vector graphic. If possible, please upload an SVG version of this image. After doing so, please replace all instances of the previous version throughout Wikipedia (noted under the “File links” header), tag the old version with {{ Vector version available|NewImage.svg}}, and remove this tag. For more information, see Wikipedia:Preparing images for upload. For assistance with converting to SVG, please see the Graphics Lab. |
 |
| |
It has been suggested that this media object be renamed to Image:Graph of largest earthquakes 1906-2005.jpg or a more suitable name for the following reason: The current title is vague and I expected to see some pastry. This request will be dealt with by a bot and/or a trusted user. |
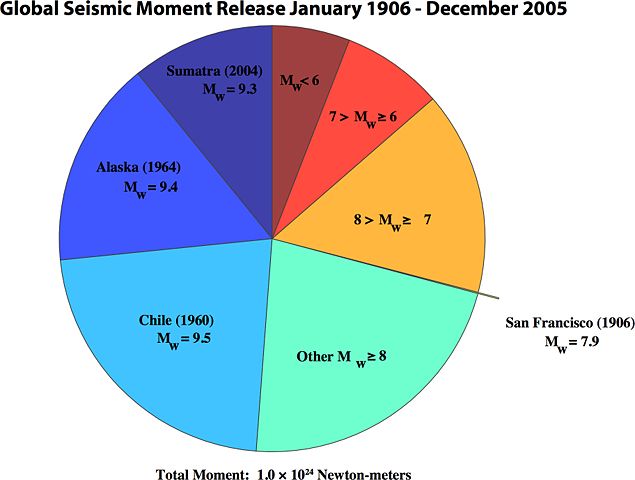
This pie chart shows how the total seismic moment released by earthquakes over the period 1906-2005 was distributed, with the largest individual earthquakes (left side) and groups of earthquakes (right side). The thin sliver of the 1906 San Francisco Earthquake is also depicted for comparison purposes. Mw designates an earthquake's magnitude on the moment magnitude scale.
Richard Aster ( New Mexico Tech) created this figure using the resources of the IRIS Consortium and the USGS. Additional data was generously provided by Lynn Sykes of Lamont-Doherty Earth Observatory, Columbia University.
Earthquakes referenced in this chart:
- Alaska (1964): Good Friday Earthquake
- Chile (1960): Great Chilean Earthquake
- San Francisco (1906): 1906 San Francisco earthquake
- Sumatra (2004): 2004 Indian Ocean earthquake
 |
This work has been released into the public domain by the copyright holder. This applies worldwide. In case this is not legally possible: |
| |
A PNG version of this image is also available, and should be used in place of this image whenever possible. If this is a fair-use image, please ensure the image has been replaced by the PNG version, and mark it for deletion by adding
For more information about the Portable Network Graphics format, see the article on PNG. |
File history
Click on a date/time to view the file as it appeared at that time.
| Date/Time | Dimensions | User | Comment | |
|---|---|---|---|---|
| current | 18:18, 26 December 2006 | 1,824×1,378 (406 KB) | Rasteraster ( Talk | contribs) | (Richard Aster created this figure using the resources of the IRIS consortium and the USGS. Additional data was generously provided by Lynn Sykes of Lamont Doherty Earth Observatory, Columbia Univerisity.) |
See the setup instructions for more information.