Image:1930Industry.svg
From Wikipedia, the free encyclopedia
1930Industry.svg (SVG file, nominally 800 × 520 pixels, file size: 10 KB)
Summary
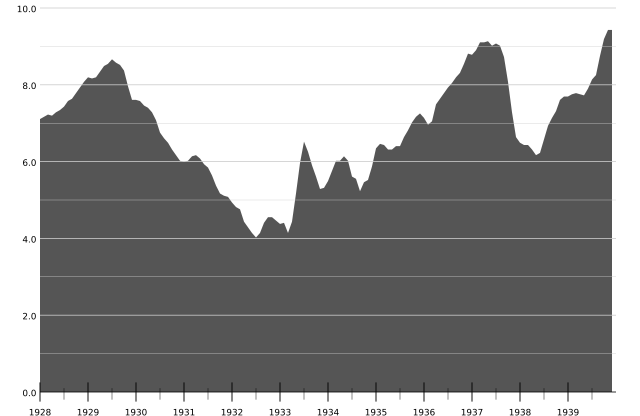
Graph of the United State's industrial production from 1928-1939 data source: http://research.stlouisfed.org/fred2/data/INDPRO.txt
This is an INDEX. The numbers on the left-hand column represent an industrial production measurement covering all industries, rather than a specific industry. The numbers do not represent money.
INDPRO is an industrial production index.
2002 = 100
| Description |
Graph of American Industrial Production Index 1928~1939 |
|---|---|
| Source |
self-made, based on "Netscape-navigator-usage-data.svg" by El_T |
| Date |
2007-12-27 |
| Author |
k.kraft |
| Permission ( Reusing this image) |
See below. |
Licensing
 |
I, the copyright holder of this work, hereby release it into the public domain. This applies worldwide. In case this is not legally possible, |
File history
Click on a date/time to view the file as it appeared at that time.
| Date/Time | Dimensions | User | Comment | |
|---|---|---|---|---|
| current | 16:15, 28 December 2007 | 800×520 (10 KB) | Ordoon ( Talk | contribs) | ({{Information |Description=Graph of the United State's industrial production from 1928-1939 data source: http://research.stlouisfed.org/fred2/data/INDPRO.txt |Source=self-made |Date=2007-12-27 |Location= |Author= |Permission= |other_versions= }}) |
See the setup instructions for more information.