Image:Mercury output2.PNG
From Wikipedia, the free encyclopedia
Size of this preview: 640 × 281 pixels
Full resolution (1,425 × 625 pixels, file size: 57 KB, MIME type: image/png)
| |
This is a file from the Wikimedia Commons. The description on its description page there is shown below. |
 |
This image was moved to Wikimedia Commons from en.wikipedia using a bot script. All source information is still present. It requires review because CommonSense could not categorise the image during transfer. Additionally, there may be errors in any or all of the information fields; information on this image should not be considered reliable and the image should not be used until it has been reviewed and any needed corrections have been made. Once the review has been completed, this template should be removed. For details, see below. |
| Description |
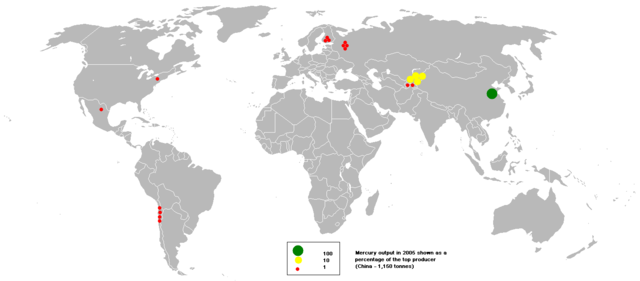
English: This bubble map shows the global distribution of mercury output in 2005 as a percentage of the the top producer (China - 1,150 tonnes).
This map is consistent with incomplete set of data too as long as the top producer is known. It resolves the accessibility issues faced by colour-coded maps that may not be properly rendered in old computer screens. Data was extracted on 30th May 2007. Source - http://www.bgs.ac.uk/mineralsuk/commodity/world/home.html Based on Image:BlankMap-World.png |
|---|---|
| Source |
Transferred from en.wikipedia |
| Date |
2007-05-30 (original upload date) |
| Author |
Original uploader was Anwar saadat at en.wikipedia |
| Permission ( Reusing this image) |
Released into the public domain (by the author).
|
 |
This map image should be recreated using vector graphics as an SVG file. This has several advantages; see Commons:Media for cleanup for more information. If an SVG form of this image is already available, please upload it. After uploading an SVG, replace this template with {{ vector version available|new image name.svg}}. |
|
العربية | Български | Català | Česky | Dansk | Deutsch | English | Esperanto | Español | Français | Galego | 한국어 | Italiano | Magyar | Lietuvių | Nederlands | 日本語 | Polski | Português | Română | Русский | Suomi | Svenska | Türkçe | Українська | 中文(繁體) | 中文(简体) | +/- |
|
License information
 |
This image has been (or is hereby) released into the public domain by its author, Anwar saadat at the wikipedia project. This applies worldwide. In case this is not legally possible: |
Original upload log
The original description page is/was here. All following user names refer to en.wikipedia.
- 2007-05-30 19:03 Anwar saadat 1425×625×8 (58487 bytes)
File history
Click on a date/time to view the file as it appeared at that time.
| Date/Time | Dimensions | User | Comment | |
|---|---|---|---|---|
| current | 18:05, 26 January 2008 | 1,425×625 (57 KB) | File Upload Bot (Magnus Manske) | ( {{BotMoveToCommons|en.wikipedia}} {{Information |Description={{en|This bubble map shows the global distribution of mercury output in 2005 as a percentage of the the top producer (China - 1,150 tonnes). This map is consistent with incomplete set of data ) |