Image:Standard deviation diagram.svg
From Wikipedia, the free encyclopedia
Standard_deviation_diagram.svg (SVG file, nominally 400 × 200 pixels, file size: 14 KB)
| |
This is a file from the Wikimedia Commons. The description on its description page there is shown below. |
Summary
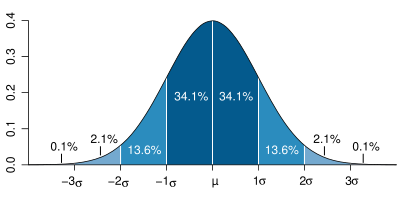
Standard deviation diagram, based an original graph by Jeremy Kemp, in 2005-02-09 . This figure was started in R using:
x <- seq(-4,4,.1)
plot(x,dnorm(x),type="n",xaxs="i",yaxs="i",ylim=c(0,.4),bty="l",xaxt="n")
polysection <- function(a,b,dist=dnorm,col="blue",n=11){
    dx <- seq(a,b,length.out=n)
    polygon(c(a,dx,b),c(0,dist(dx),0),border=NA,col=col)
}
library(RColorBrewer)
cols<-rev(brewer.pal(4,"Blues"))
for(i in 0:3){
    polysection(i,i+1,col=cols[i+1])
    polysection(-i-1,-i,col=cols[i+1])
}
sx <- -3:3
segments(sx,0,sx,dnorm(sx),col="white")
lines(x,dnorm(x))
axis(1,sx,sx)
It was then touched up in Adobe Illustrator, and re-saved in Inkscape.
| |
This chart was created with R. |
Licensing
| |
This file is licensed under Creative Commons Attribution 2.5 License In short: you are free to distribute and modify the file as long as you attribute its author(s) or licensor(s). |
File history
Click on a date/time to view the file as it appeared at that time.
| Date/Time | Dimensions | User | Comment | |
|---|---|---|---|---|
| current | 11:08, 7 April 2007 | 400×200 (14 KB) | Petter Strandmark | (== Summary == Standard deviation diagram, based an original graph by Jeremy Kemp, in 2005-02-09 [http://pbeirne.com/Programming/gaussian.ps]. This figure was started in R using: <pre> x <- seq(-4,4,.1) plot(x,dnorm(x),type) |
File links
The following pages on Schools Wikipedia link to this image (list may be incomplete):