Image:The Normal Distribution.svg
From Wikipedia, the free encyclopedia
The_Normal_Distribution.svg (SVG file, nominally 800 × 600 pixels, file size: 121 KB)
| |
This is a file from the Wikimedia Commons. The description on its description page there is shown below. |
Summary
| Description |
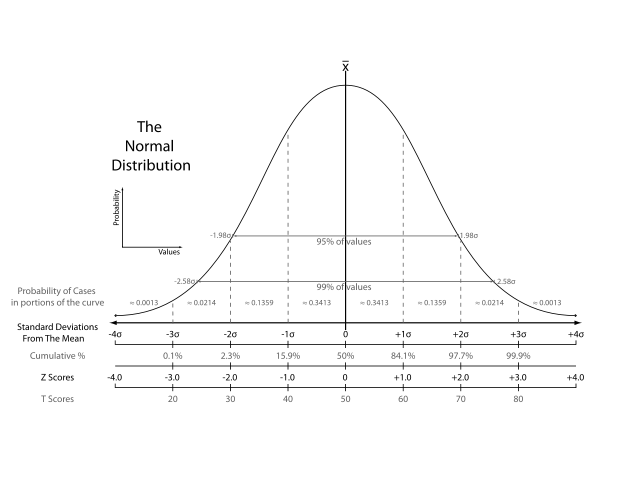
The re-drawn chart comparing the various grading methods in a normal distribution. Includes: Standard deviations, cumulative percentages, percentile equivalents, Z-scores and T-scores. Inspired by Figure 4.3 on Page 74 of Ward, A. W., Murray-Ward, M. (1999). Assessment in the Classroom. Belmont, CA: Wadsworth. ISBN 0534527043 |
|---|---|
| Source |
Originally from en.wikipedia; description page is/was here. |
| Date |
2007-07-12 (first version); 2007-07-12 (last version) |
| Author |
Original uploader was Heds 1 at en.wikipedia |
| Permission ( Reusing this image) |
Released into the public domain (by the author).
|
Discussion
Is the 1.98 sigma/z-score for 95th percentile a typo? 1.96 is nearer 95% than 1.98 which corresponds to 95.2269%...
Y axis stands not for probability, as stated, but rather for probability density. Probability itself is zero for each given point. I think this is the important point. yes this plot is wrong !
License information
 |
This image has been (or is hereby) released into the public domain by its author, Heds 1 at the wikipedia project. This applies worldwide. In case this is not legally possible: |
Original upload log
(All user names refer to en.wikipedia)
- 2007-07-12 14:47 Heds 1 800×600×0 (123727 bytes) A re-drawn chart comparing the various grading methods in a normal distribution. Includes: Standard deviations, cumulative percentages, percentile equivalents, Z-scores and T-scores. Inspired by Figure 4.3 on Page 74 of Ward, A. W., Murray-Ward, M. (1999)
- 2007-07-12 14:44 Heds 1 800×600×0 (137472 bytes) The re-drawn chart comparing the various grading methods in a normal distribution. Includes: Standard deviations, cumulative percentages, percentile equivalents, Z-scores and T-scores. Inspired by Figure 4.3 on Page 74 of Ward, A. W., Murray-Ward, M. (199
Licensing
|
|
I, the copyright holder of this work, hereby release it into the public domain. This applies worldwide. In case this is not legally possible: Afrikaans | Alemannisch | Aragonés | العربية | Asturianu | Български | Català | Cebuano | Česky | Cymraeg | Dansk | Deutsch | Eʋegbe | Ελληνικά | English | Español | Esperanto | Euskara | Estremeñu | فارسی | Français | Galego | 한국어 | हिन्दी | Hrvatski | Ido | Bahasa Indonesia | Íslenska | Italiano | עברית | Kurdî / كوردی | Latina | Lietuvių | Latviešu | Magyar | Македонски | Bahasa Melayu | Nederlands | Norsk (bokmål) | Norsk (nynorsk) | 日本語 | Polski | Português | Ripoarisch | Română | Русский | Shqip | Slovenčina | Slovenščina | Српски / Srpski | Suomi | Svenska | ไทย | Tagalog | Türkçe | Українська | Tiếng Việt | Walon | 中文(简体) | 中文(繁體) | zh-yue-hant | +/- |
File history
Click on a date/time to view the file as it appeared at that time.
| Date/Time | Dimensions | User | Comment | |
|---|---|---|---|---|
| current | 10:48, 23 September 2007 | 800×600 (121 KB) | Abdull | ({{Information |Description=The re-drawn chart comparing the various grading methods in a normal distribution. Includes: Standard deviations, cumulative percentages, percentile equivalents, Z-scores and T-scores. Inspired by Figure 4.3 on Page 74 of Ward, ) |