Image:Glacier Mass Balance.png
From Wikipedia, the free encyclopedia
Size of this preview: 631 × 479 pixels
Full resolution (658 × 500 pixels, file size: 24 KB, MIME type: image/png)
| |
This is a file from the Wikimedia Commons. The description on its description page there is shown below. |
Contents |
Description
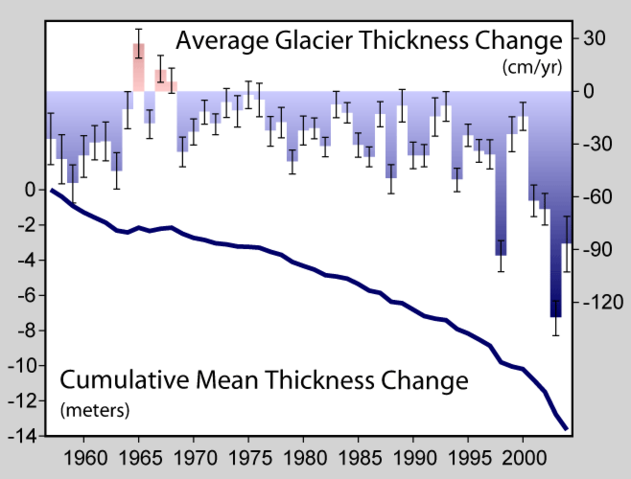
This figure shows the average rate of thickness change in mountain glaciers around the world. This information, known as the glaciological mass balance, is found by measuring the annual snow accumulation and subtracting surface ablation driven by melting, sublimation, or wind erosion. These measurements do not account for thinning associated with iceberg calving, flow related thinning, or subglacial erosion. All values are corrected for variations in snow and firn density and expressed in meters of water equivalent (Dyurgerov 2002).
Measurements are shown as both the annual average thickness change and the accumulated change during the fifty years of measurements presented. Years with a net increase in glacier thickness are plotted upwards and in red; years with a net decrease in glacier thickness (i.e. positive thinning) are plotted downward and in blue. Only three years in the last 50 have experienced thickening in the average.
Systematic measurements of glacier thinning began in the 1940s, but fewer than 15 sites had been measured each year until the late 1950s. Since then more than 100 sites have contributed to the average in some years (Dyurgerov 2002, Dyurgerov and Meier 2005). Error bars indicate the standard error in the mean.
Other observations, based on glacier length records, suggest that glacier retreat has occurred nearly continuously since the early 1800s and the end of the little ice age, but variations in rate have occurred, including a significant acceleration during the twentieth century that is believed to have been a response to global warming (Oerlemans 2005).
Data
These measurements are described in Dyurgerov (2002), updated in Dyurgerov and Meier (2005), and archived at the World Glacier Monitoring Service at the National Snow and Ice Data Centre.
Copyright
This figure was prepared by Robert A. Rohde from published data and is part of the Global Warming Art project.
This image is an original work created for Global Warming Art.
Permission is granted to copy, distribute and/or modify this image under either:
- The GNU Free Documentation License Version 1.2; with no Invariant Sections, Front-Cover Texts, or Back-Cover Texts.
- The Creative Commons Attribution-NonCommercial-ShareAlike License Version 2.5
Please refer to the image description page on Global Warming Art for more information
 |
Permission is granted to copy, distribute and/or modify this document under the terms of the GNU Free Documentation License, Version 1.2 only as published by the Free Software Foundation; with no Invariant Sections, no Front-Cover Texts, and no Back-Cover Texts. A copy of the license is included in the section entitled " Text of the GNU Free Documentation License." Català | English | Español | Français | 日本語 | Polski | Português | Русский | Tiếng Việt | 中文(简体) | 中文(繁體) | +/- |
References
- Dyurgerov, Mark B. (2002). "Glacier Mass Balance and Regime: Data of Measurements and Analysis". Institute of Arctic and Alpine Research, Occasional Paper 55.
- Dyurgerov, Mark B. and Mark F. Meier (2005). "Glaciers and the Changing Earth System: A 2004 Snapshot". Institute of Arctic and Alpine Research, Occasional Paper 58.
- J. Oerlemans (2005). "Extracting a Climate Signal from 169 Glacier Records". Science 308 (5722): 675-677. DOI: 10.1126/science.1107046.
Other versions
 Portuguese |
File history
Click on a date/time to view the file as it appeared at that time.
| Date/Time | Dimensions | User | Comment | |
|---|---|---|---|---|
| current | 11:37, 13 September 2006 | 658×500 (24 KB) | Nils Simon | (== Description == This figure shows the average rate of thickness change in mountain glaciers around the world. This information, known as the glaciological mass balance, is found by measuring the annua) |