Image:Price-Earnings Ratios as a Predictor of Twenty-Year Returns (Shiller Data).png
From Wikipedia, the free encyclopedia
Size of this preview: 600 × 480 pixels
Full resolution (948 × 758 pixels, file size: 29 KB, MIME type: image/png)
| |
This is a file from the Wikimedia Commons. The description on its description page there is shown below. |
Summary
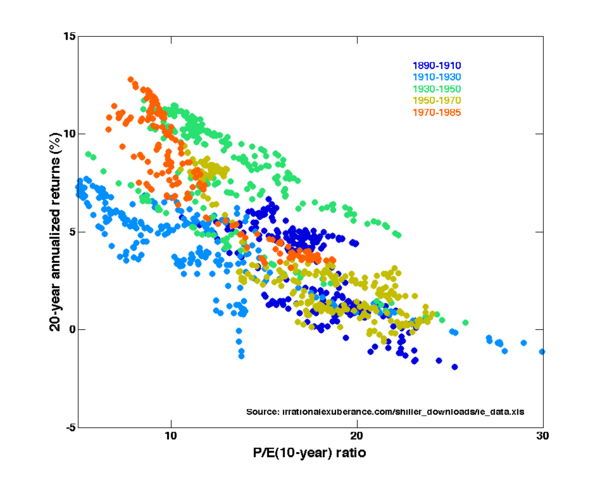
| Description |
Price-Earnings Ratios as a Predictor of Twenty-Year Returns: A twenty-year modification of the plot by w:Robert Shiller (Figure 10.1 from Shiller, Robert (2005). Irrational Exuberance (2d ed.). Princeton University Press. ISBN 0-691-12335-7.) using data from irrationalexuberance.com/shiller_downloads/ie_data.xls. The horizontal axis shows the real price-earnings ratio of the S&P Composite Stock Price Index as computed in Irrational Exuberance (inflation adjusted price divided by the prior ten-year mean of inflation-adjusted earnings). The vertical axis shows the geometric average real annual return on investing in the S&P Composite Stock Price Index, reinvesting dividends, and selling twenty years later. Data from different twenty year periods is colour-coded as shown in the key. See also Image:Price-Earnings Ratios as a Predictor of Ten-Year Returns (Shiller Data).png. |
|---|---|
| Source |
self-made |
| Date |
February 16, 2008 |
| Author |
Stsmith |
| Permission ( Reusing this image) |
see below
|
Licensing
|

File history
Click on a date/time to view the file as it appeared at that time.
| Date/Time | Dimensions | User | Comment | |
|---|---|---|---|---|
| current | 22:04, 16 February 2008 | 948×758 (29 KB) | Stsmith | ({{Information |Description=Price-Earnings Ratios as a Predictor of Twenty-Year Returns: A twenty-year modification of the plot by w:Robert Shiller (Figure 10.1 from {{cite book |last=Shiller |first=Robert |title=[[Irrational Exuberance (book)|Irration) |